Regional overview
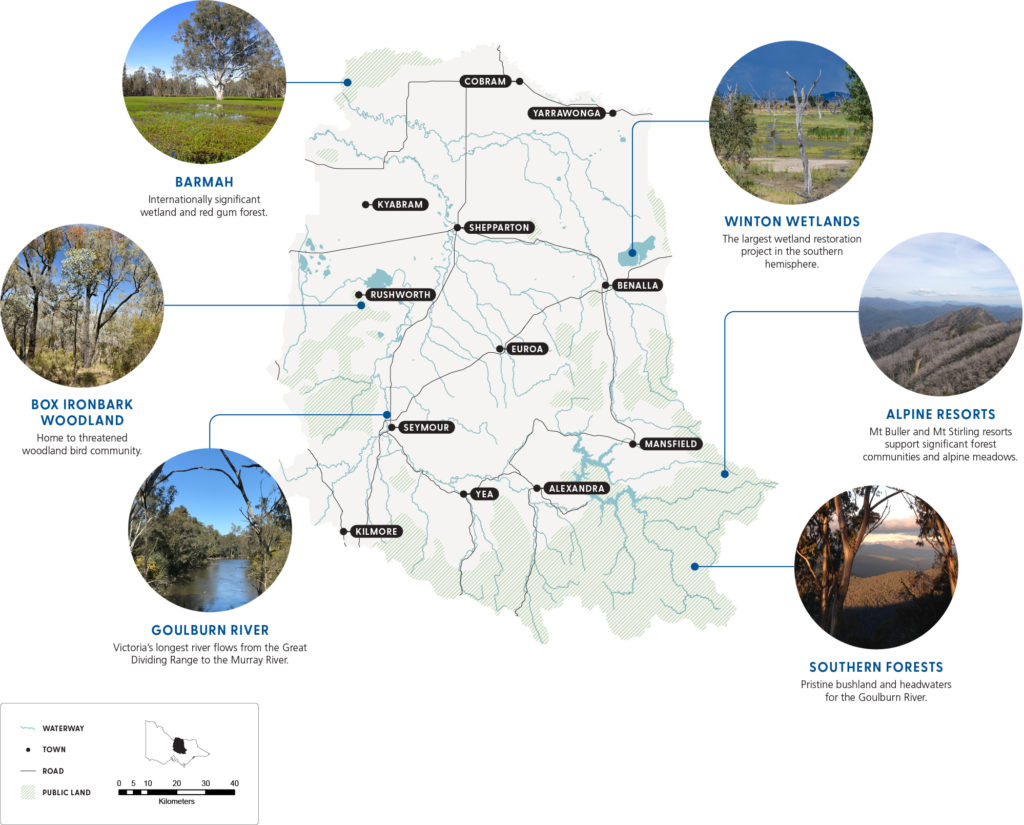
The Goulburn Broken Catchment is situated in Victoria and is part of the Murray-Darling Basin. It encompasses the valleys of the Goulburn and Broken rivers and part of the Murray Valley, covering 10.5% of Victoria. The catchment stretches from close to the outskirts of greater Melbourne in the south, to the Murray River in the north, Mt Buller to the east and the Mt Camel Range to the west (Figure 7).
The catchment includes two Registered Aboriginal Parties representing the interests of Traditional Owners for their respective Country: Yorta Yorta Nation Aboriginal Corporation (YYNAC) and Taungurung Land and Waters Council (TLaWC). This includes active involvement in NRM through joint management agreements and legislative rights to public land. Click here to read more about YYNAC and TLaWC.
Land use is diverse across the catchment, with approximately 63% managed for agricultural production and the remaining 37% a mix of nature conservation, forestry, rural residential and urban (ABARES 2018). The catchment’s natural resources, mild climate, proximity to Melbourne and major transport routes support major agricultural, forestry and tourism industries. They also make it an attractive place to live for the expanding rural lifestyle population.

Figure 7: Map of the Goulburn Broken Catchment showcasing some of the unique natural features
Click on the tabs below to discover more about the catchment’s natural resources and the factors influencing their condition and management.
Catchment condition
The catchment’s natural resources provide a range of services that people value, including:
- ecosystem, such as clean air, drinking water, community health and wellbeing
- economic, such as agriculture and tourism
- lifestyle, such as beautiful scenery and job opportunities
- recreation, such as fishing, skiing and camping.
The condition of the catchment’s natural resources can be assessed by looking at the themes of biodiversity, community, land and water. The community theme referes to the capacity and resilience of the community and is a focus because engagement in NRM is a major driver of biodiversity and water health.
Qualitative condition ratings for each theme have been reported by the Goulburn Broken CMA since 1990 using available evidence. These ratings have been drawn from Goulburn Broken CMA annual reports, tipping points described by the community, socio-economic research and the discussion paper developed as part of the strategy renewal. A snapshot of the current condition and trends for each theme is shown in Table 5. Detailed assessment of the current condition, trends and drivers of change for each natural resource theme is here.
Natural systems can respond to change in a number of ways or phases. The response phase for each theme is listed in Table 5. The 3 main response phases are:
- Persistence: the system stays the same in the face of change.
- Adaptation: management actions are modified in response to change and the changes endure while the purpose of the system remains the same.
- Transformation: the system fundamentally alters in response to change, where management and the overall purpose of the system changes.
Table 5: A snapshot of catchment condition for biodiversity, community, land and water, including trends since 2013 in the Goulburn Broken Catchment.
| Theme | Current condition | Trend since 2013 | Response phase* | Long-term risk (given current support) |
|---|---|---|---|---|
| Biodiversity | Poor | Declining | Transformation | Very high |
| Community | Satisfactory | Stable | Adaptation and transformation | Medium |
| Land | Satisfactory | Stable | Adaptation | Medium |
| Water | Satisfactory | Declining | Adaptation and transformation | Medium |
Community values
A diversity of values and perspectives are held across the catchment, shaping its identity and increasing its resilience to change. Understanding diversity and shared values is important as collaborative action is required to achieve positive change for our natural resources.
The shared values of the catchment’s community were collated from discussions with over 500 people and are highlighted below:
- diversity of people, industry, land use and landscapes
- community connectedness and a feeling of belonging
- country lifestyle that is safe and has access to services
- Traditional Owners connection to Country
- landscape beauty that includes tall trees, rivers, wetlands and a rich biodiversity
- economic opportunities for towns, industries and Caring for Country activities
- nature supporting human health and wellbeing.
As well as understanding shared values, it is important to understand where there are different values which can cause NRM challenges. Sustainability dilemmas arise when there are different values and conflict over how to prioritise social, economic and environmental interests.
Drivers of change
The strategy plays an important role in navigating change in a complex system. Major drivers of change and emerging trends impacting the catchment’s natural resources were identified through community engagement and socio-economic analysis, as part of the strategy’s renewal. They are described below. In response, priority actions have been developed to adapt, and in some cases transform, current management practices. These are described in detail in the theme and local area sections.
Catchment drivers
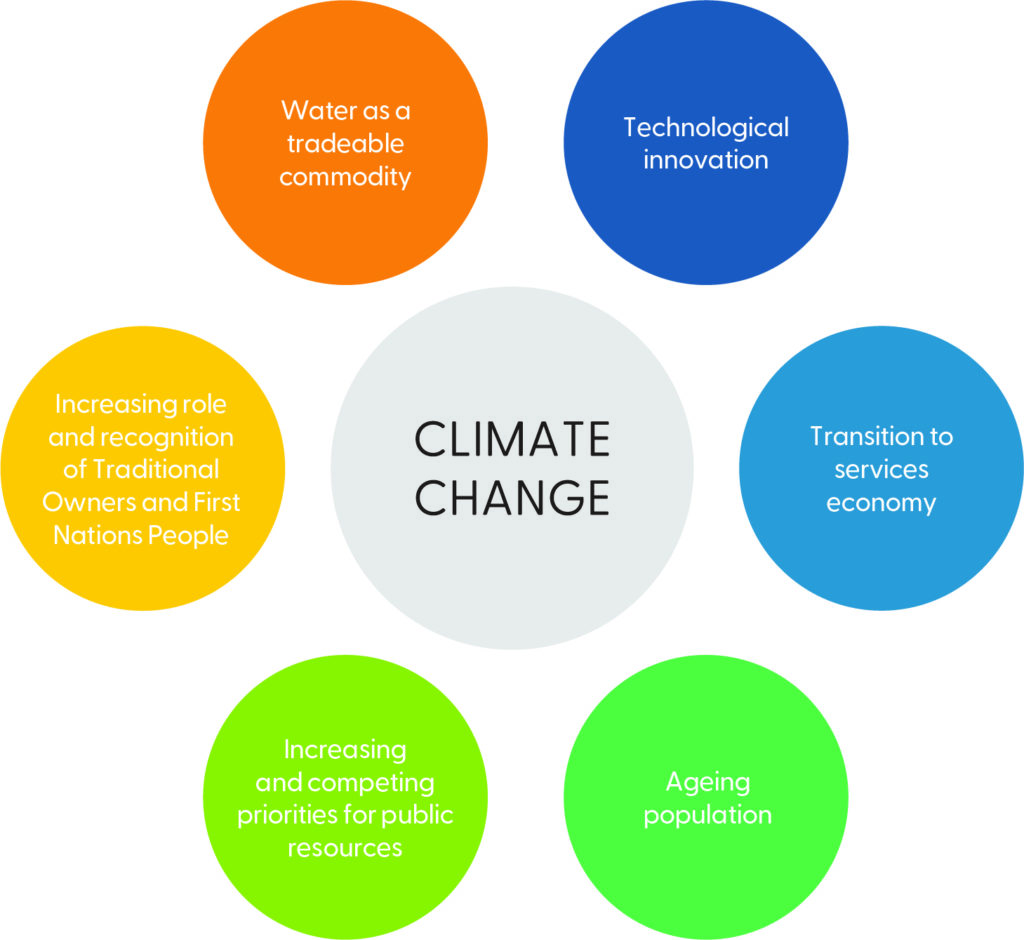
Drivers of change are forces that influence how the catchment operates and shape future pathways. The major drivers of change impacting NRM across the region are outlined in Figure 5 and Table 6. Climate change is the most significant driver of change because it impacts all the other drivers and trends.

While these drivers of change are obvious, and to an extent predictable, the way we respond makes them far more complex, less predictable and with the potential to create unforeseeable outcomes. In addition, unanticipated or acute shocks, such as COVID-19, fire, flood or industry adjustment, can have a major impact on catchment dynamics and the natural resources.
Table 6: Major drivers of change and what they lead to in the Goulburn Broken Catchment
| Primary drivers | Leading to |
|---|---|
| Climate change | • Community recognising the impact of climate change and the need for urgent action. • Increased temperatures in all seasons. • Decreased average annual rainfall and changing seasonal patterns. • Increased frequency and intensity of extreme rainfall events. • Longer and more severe drought. • Reduced catchment water yields (stream flow and total water resource). • Negative flow-on effects of reduced water yield on water quality (including stream temperatures) and aquatic ecology. • Drier conditions resulting in vegetation decline and reduced habitat for animals. • Increased stress on animals due to the frequency and severity of heatwaves. • Increased frequency and severity of bushfires. • Victorian Climate Change Act, emission reduction targets. • Changed distribution and incidence of pests and diseases. |
| Technological innovation | • Renewable energy technologies rapidly expanding as industries and energy generation transition to zero emissions, such as solar farms. • Farms expanding with less labour. • Older people remain managing land. • More people working from home. • Emergence of online businesses. • Social media as a platform for communication. • GPS guidance and mapping technologies for precision agriculture. • Rapid expansion of technology supporting agriculture and other industries, such as drones and mobile apps. • Virtual fencing for livestock enterprises. |
| Transition to services economy | • Urban population growth. • High housing prices in cities and towns. • Increased demand for lifestyle blocks close to cities and towns. • Increased urban incomes and demand for recreation and amenity experiences. • Younger population in high growth areas with affordable housing and commuting distance to service centres. • Increased land prices making it difficult for farm expansion. • Rural lifestyle gentrification pressures and weekender patterns of settlement. • High tourism related employment in locations close to mountains or waterways. • Increased economic opportunities for wineries, horse studs and high value agriculture close to waterways. |
| Ageing population | • Increased employment in health and human services. • Reduced membership for community groups. |
| Increasing and competing priorities for public resources | • Increasing the need for community volunteer’s time, knowledge and other contributions to NRM projects. • Increasing need to balance the accountability requirements of community grants (e.g. reporting, competitive grant and tender processes) and the available volunteers. • Increased complexity for local community and regional groups to engage in decision making and raise local priorities. |
| Increasing role and recognition of Traditional Owners and First Nations People | • Greater inclusion of Traditional Owners in NRM. • A more complex processes for decision making and implementation as legislative changes formalise co-management of specific areas and legal obligations for land managers of Crown land. • A need for more resources for greater acknowledgement, integration and incorporation of traditional ecological knowledge. • Greater acknowledgement of cultural aspirations and strategies, as documented in Country Plans, which provide guidance and work plans for Traditional Owner groups. |
| Water as a tradeable commodity | • Water rights and use moving to the highest value commodities. • Creation of environmental water entitlements. • Transfer of irrigation water out of the catchment to meet downstream demands. • Competition for water between environmental, cultural, recreational, agricultural, urban and investment uses. • Opportunities for Traditional Owners to own water for business or cultural uses. • Potential for new industries (such as hydrogen production) to increase pressure on water resources. |
Catchment trends
As a result of the drivers, a number of trends or changes are emerging at the catchment-scale for NRM. Four broad catchment trends were identified by the community and are outlined in Table 7.
Table 7: Emerging trends identified by the community in the Goulburn Broken Catchment since 2013
| Trend | Description |
|---|---|
| Agriculture is changing | • Next generation of farmers have higher education levels and greater environmental awareness. • Big farms are getting bigger in dryland areas. • More corporate farms. • Reduced dairy and increased cropping in the north. • Emergence of new industries, such as solar farms. • Increased off-farm income. • More lifestyle and hobby farms. • Urban expansion in the south. |
| Biodiversity is under pressure | • Greater community awareness of the importance of nature. • Increased community and visitor use of nature for recreation, such as fishing, four-wheel driving and camping. • Declining condition and health of habitat (such as woodland birds, insects and canopy collapse) with new threats (such as climate change, recreation, urban encroachment and firewood collection) compounding existing threats (such as pests plants, animals and clearing). • Adapting revegetation species to match new climate conditions. • Increased vegetation cover and connection with land use change from agriculture to lifestyle properties, such as around Rushworth. • Loss of scattered paddock trees and vegetation connection due to an increase in cropping in other areas. |
| Water issues are more prominent and complex | • Hotter, drier and more extreme events are the new normal, increasing pressure on water resources. • Water priorities and direction driven from outside the catchment impact availability and unseasonal movement of irrigation water in the Goulburn River and Barmah National Park. • Water scarcity and the threats of future impacts from climate change have resulted in a complicated scenario for incorporating Traditional Owner aspirations. |
| Urban population and land use is changing | • The population in towns in has increased by 50% since 1981. Larger towns show consistent growth (Barr 2020). • Increased dormitory areas where people work in major towns (such as Shepparton and Benalla) or Melbourne but live in the hinterland surrounding the towns or in the south of the catchment in close proximity to Melbourne (Barr 2020) . • Mansfield, Nagambie, Yarrawonga and other locations are growing with many absentee owners (Barr 2020) . • More lifestyle and retiree landholders (Barr 2020) . • Population decline is more common with isolation (e.g. Eildon, Jamison, Goughs Bay) or historically agriculturally or railway dependent towns (e.g. Rushworth, Girgarre, Stanhope) (Barr 2020) . • Seymour and Benalla show long-term population decline. Benalla’s decline is possibly due to planning constraints and an ageing population associated with declining household size; while Seymour has a history of economic dependence on the railway and the Puckapunyal army base (Barr 2020). • A growing number of people moving to regional and rural areas, as a result of the COVID-19 pandemic. It is uncertain whether this trend will persist. • Values for agricultural land continue to grow, with compound annual growth of 7% over the last 20 years for northern Victoria (Australian Farmland Values, Rural Bank 2021). Current favourable seasonal conditions and strong commodity prices are resulting in strong prices for cropping and grazing land, while the lifestyle market remains strong around Mansfield and Alexandra (Rural Bank 2021). Mansfield and Mitchell Shires have seen a significant increase in total share of transaction volume and attract a higher price per hectare than other municipalities (Rural Bank 2021). |
Local areas

The strategy enables planning at a catchment-wide and local area level, allowing priorities and actions to be set at the most relevant scale.
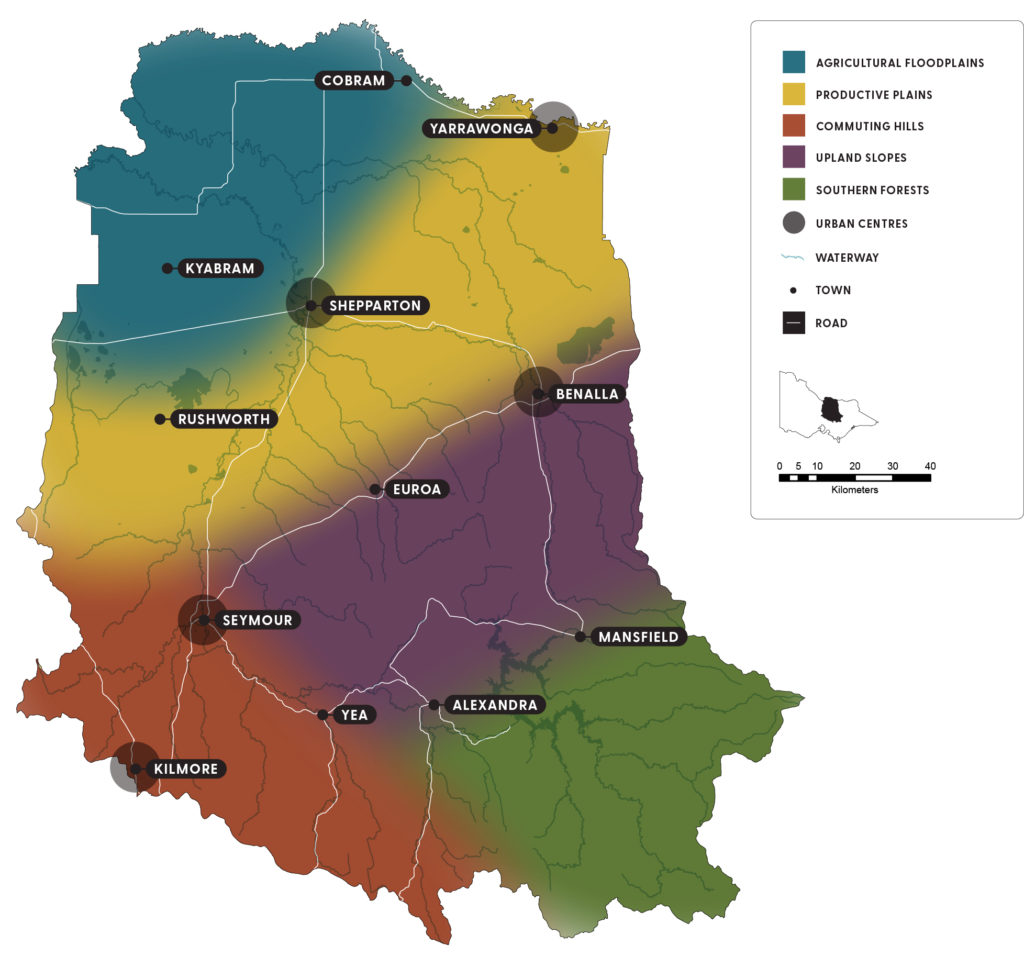
Local areas are systems of people and places that have much in common socially, economically and ecologically. They are also known as social-ecological systems or sub-catchment areas.
Figure 9 shows the 6 local areas for the strategy.
These local areas reflect the catchment’s social and biophysical systems, community priorities and interests and highlight the connection of land, water, biodiversity and community. Figure 9 also shows the connection between the local areas, rather than sharp boundaries.
These local areas were developed previously and are still considered appropriate given community feedback and insights from a socio-economic analysis of 2016 ABS census data.
The local area section of the strategy reflects the local communities’ priorities and interests.
Show your support
Pledge your support for the Goulburn Broken Regional Catchment Strategy and its implementation.


